- Home /
- System Design /
- How a Request Travels Through a Modern Backend
How a Request Travels Through a Modern Backend
- By Manaswini De • Software Engineer & Instructor at CodeKerdos
You tap Place order. A fraction of a second later, a green checkmark appears. In that blink, your request has been looked up, encrypted, routed, authenticated, rate-checked, validated, charged, saved and announced to half a dozen other systems – by machines that may sit in different data centers and were built by different teams.
Most engineers know each of those stops in isolation. Far fewer can trace the whole route end to end, and that’s exactly the skill that separates someone who can debug a slow checkout from someone who can only say “it’s slow.” It’s also the skill system design interviews are quietly testing.
This post follows a single request – POST /api/orders – from the tap to the checkmark, one stop at a time. Along the way you’ll see the pieces from earlier posts in this series (load balancers, JWTs, rate limiters, Redis, replicas) show up exactly where they belong.
The Journey at a Glance
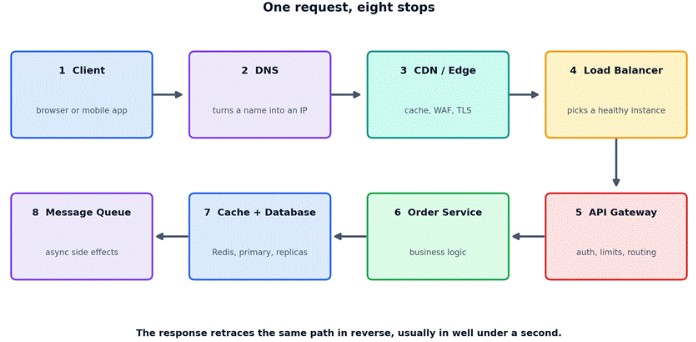
Figure 1 – Eight stops between the tap and the checkmark.
Each stop does one narrow job and hands the request to the next. We’ll visit them in order, then zoom out to see the whole trip as a trace, look at how it breaks, and finish with the problem every write request has: arriving twice.
Stop 2: DNS - Finding Out Where to Go
The app knows the name api.shop.example, but networks route to IP addresses. Before anything else can happen, the name has to be resolved.
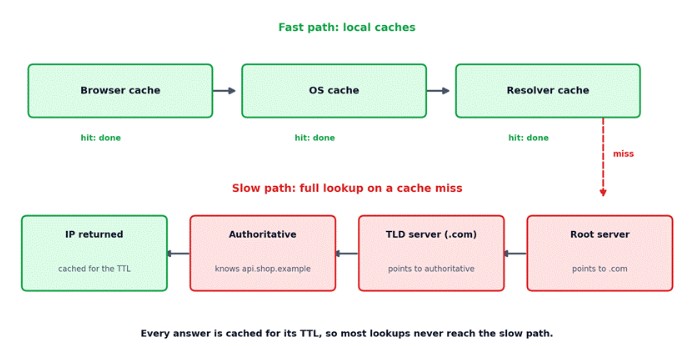
Figure 2 – Local caches answer most lookups; the full chain is the fallback.
The lookup checks the cheapest places first: the browser’s own cache, then the operating system’s, then a recursive resolver (usually run by your ISP or a public DNS provider). Only on a miss does the resolver walk the hierarchy – a root server points to the right top-level-domain server, which points to the authoritative server that actually knows the answer. Whatever comes back is cached for its time-to-live (TTL), so the next lookup is nearly free.
Worth Remembering
DNS changes are never instant. Because every layer caches the old answer until its TTL runs out, repointing a record during an incident can take minutes or hours to reach everyone. Teams that expect to fail over via DNS lower the TTL before they need to, not after.
Connecting Securely: TCP, TLS and HTTP
With an IP address in hand, the client still can’t send the order. It first has to open a connection and agree on encryption.
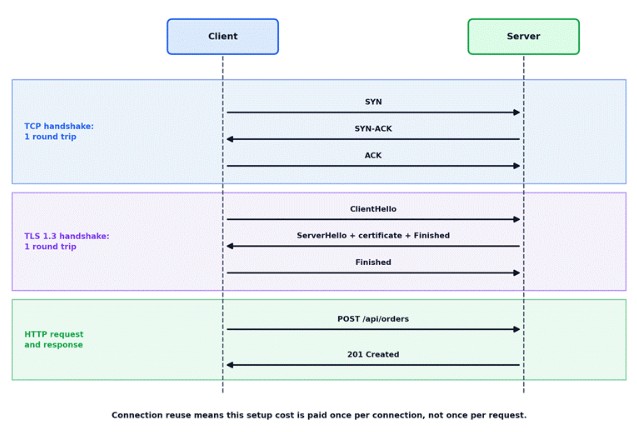
Figure 3 – Setup costs a few round trips before the first byte of your request travels.
- TCP handshake. SYN, SYN-ACK, ACK: one round trip to establish a reliable connection.
- TLS handshake. The server proves its identity with a certificate and both sides agree on keys. TLS 1.3 does this in one round trip; older TLS 1.2 needs two.
- HTTP request. Only now does POST /api/orders actually travel.
This is why connection reuse matters so much. HTTP/2 multiplexes many requests over one connection, and HTTP/3 runs over QUIC, which folds the transport and encryption handshakes together. Either way, the setup cost is paid once per connection, not once per request. It’s also the root of the long-lived connection trap from the load balancer post: a connection that lives for minutes carries a lot of requests, so where it lands matters.
Stop 3: The Edge - CDN and Firewall
The first server the request meets is usually not yours. It’s an edge location run by a CDN, sitting geographically close to the user. Its job depends on what’s being asked for:
- Static content (images, JavaScript, CSS) is served straight from the edge cache, and never reaches your servers at all.
- Dynamic requests like our order can't be cached, so the edge passes them through to your origin over a connection it already keeps warm.
- Protection happens here too: a web application firewall filters common attack patterns, and the edge absorbs floods of junk traffic before they reach infrastructure that has to pay for every request.
Stop 4: The Load Balancer
Your origin isn’t one server. It’s a fleet, and something has to pick which instance of the gateway handles this request. That’s the load balancer’s job: choose a healthy instance, skip the ones failing their health checks, and give clients a single stable address in front of a fleet that changes constantly.
We covered how that works in detail in the previous post, Why Every Distributed System Has a Load Balancer. For our request, the takeaway is simple: this hop is invisible when it works and is the reason a single crashed server doesn’t become your outage.
Stop 5: The API Gateway - The Front Desk
By now the request looks like this on the wire. The gateway is about to add one more header, a request ID, once it has decided to let the request through:
POST /api/orders HTTP/2

Host: api.shop.example

Authorization: Bearer eyJhbGciOi...

Idempotency-Key: 7c9e6679-7425-40de-944b-e07fc1f90ae7

Content-Type: application/json


{ "cartId": "c_482", "paymentMethodId": "pm_91" } 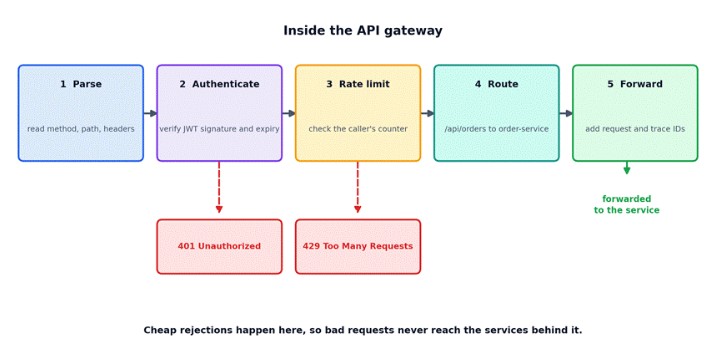
Figure 4 – The gateway rejects bad requests cheaply, before any service does real work.
- Authenticate. The gateway verifies the JWT's signature and expiry. Nothing is looked up in a session store, which is exactly the stateless property from the Stateless vs. Stateful post: any gateway instance can validate any token.
- Rate limit. It checks the caller's counter, typically held in Redis, and answers 429 if they're over budget. The Designing a Rate Limiter post covers the algorithms behind this.
- Route. It maps the path to a service and finds a healthy instance of it, usually through service discovery or the platform's built-in DNS.
- Forward. It stamps the request with an ID (commonly an X-Request-ID header and a trace header such as W3C's traceparent) so every service downstream can be tied back to this one request.
Notice the design principle: the gateway is where cheap decisions live. A request with an expired token costs a signature check, not a database query.
Stop 6: The Service Layer - Where the Work Happens
The order service now does the real work. It’s also where the most important design decision of the whole journey gets made: what must the user wait for, and what can happen later?
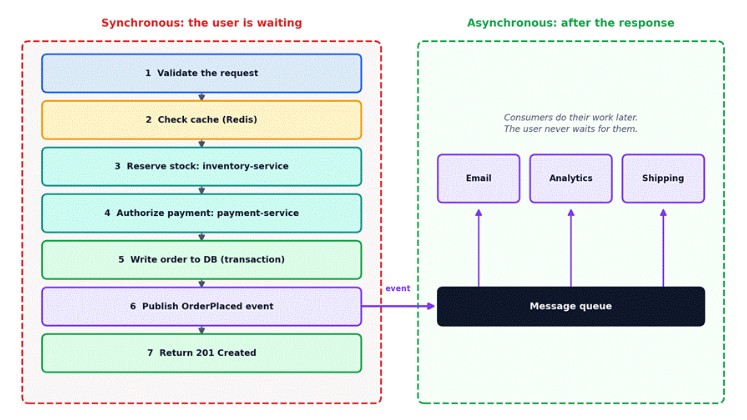
Figure 5 – Only the work the user needs an answer for stays on the synchronous path.
Inside the dashed red box is the synchronous path. The service validates the input, checks Redis for anything it can answer from cache, calls the inventory service to reserve stock and the payment service to authorize the card, writes the order to the database in a transaction, publishes an OrderPlaced event, and returns 201 Created. Every step here is on the user’s clock.
The email confirmation, the analytics record and the shipping label don’t need to finish before the checkmark appears. They happen in the green box: consumers read the event from a message queue and do their work afterwards. Moving work from the left side to the right side is one of the highest-leverage ways to make a backend feel faster and be more resilient, because a slow email provider can no longer slow down checkout.
But Isn't the Load Balancer a Single Point of Failure?
Yes – if you deploy exactly one. This is the objection every interviewer eventually raises, and the answer is that the load balancer needs the same redundancy it provides to everyone else.
- Active-passive pairs. Two load balancers share a floating IP address. A standby watch the active one via heartbeats and takes over the address if it stops responding. Tools like keepalived implement this pattern.
- Active-active fleets. Several load balancers all serve traffic, spread via DNS or anycast routing, so there's no single box to lose.
- Managed cloud load balancers. Cloud providers run the load balancer as a distributed service across multiple availability zones, so the redundancy is their problem, not yours.
The Dual-Write Trap
Step 5 writes to the database and step 6 publishes to the queue. Those are two separate systems, so if the service crashes between them you get an order with no event, and the customer never gets an email or a shipment. The standard fix is the transactional outbox pattern: write the event to an outbox table in the same database transaction as the order, and let a separate process publish it. The order and its event then succeed or fail together.
Stop 7: The Data Layer - Cache, Primary and Replicas
Three kinds of storage serve the request, each for a different reason, and each one is a post in this series:
- Redis, as a cache. Hot reads like product details and prices are checked here first (the cache-aside pattern), so most of them never touch the database.
- The primary database, for writes. Our order is a write, so it goes to the primary, which is the only copy allowed to accept it.
- Read replicas, for everything else. Browsing order history reads from a replica to take load off the primary.
There’s a subtle trap where the last two meet. Right after the order is written, the confirmation page might read from a replica that hasn’t caught up yet and show “no such order.” This is replication lag, and the usual fixes are to read that one record from the primary or to return the order in the response of the write itself.
Stop 8: The Return Trip
The 201 Created response retraces the route in reverse. The service hands it to the gateway, which writes an access-log line and may add headers. It passes through the load balancer and the edge, possibly compressed, down the same warm connection, and the app turns it into a checkmark. The connection stays open, ready for the next request.
The latency the user feels is the sum of every one of these hops, which raises the obvious question: when it’s slow, which hop is responsible?
Seeing the Whole Journey: Distributed Tracing
This is what the trace ID from the gateway is for. Every service that touches the request records a span – a named, timed slice of work – tagged with the same trace ID, and a tracing system stitches them into one timeline.
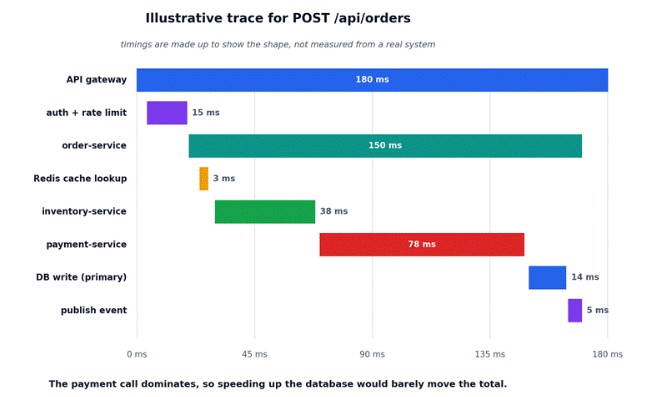
Figure 6 – A trace shows where the time actually went. (Timings here are illustrative, not measured.)
Read the trace from the top: the gateway span wraps everything, the order-service span sits inside it, and its children show the calls it made. In this illustration the payment call takes the biggest share of the total. Shaving the database write from 14 ms to 7 ms would barely register, while a faster payment call, or running it in parallel with the stock reservation, would move the whole number.
That’s the real value of tracing: it replaces guessing with measurement. Together with logs (what happened) and metrics (how often and how fast), traces (where the time went) are the three pillars of observability. OpenTelemetry has become the common standard for producing them, and tools such as Jaeger and Zipkin can display them.
What Happens When a Hop Fails
Every arrow in Figure 1 is a place where something can be slow, broken or overloaded. Mature backends plan for each one:
| Hop | Typical failure | Common defense |
|---|---|---|
| DNS | Slow or stale resolution | Sensible TTLs, caching at several levels, more than one resolver |
| Edge / CDN | Origin unreachable | Health-checked origins, serving stale content where that's safe |
| Load balancer | A backend instance is down | Health checks, removal from the pool, retry on another instance for safe requests |
| API gateway | Overload or an abusive client | Rate limits, early 401 and 429 responses, load shedding |
| Service-to-service call | A dependency is slow or failing | Timeouts, bounded retries with backoff, circuit breakers |
| Database | Primary slow or unavailable | Connection pooling, query timeouts, replica promotion, backpressure |
| Message queue | Broker down or consumer failing | Transactional outbox, retries with backoff, dead-letter queue |
The circuit breaker deserves a sentence of its own. It watches calls to a dependency, and once enough of them fail it “opens” and fails fast instead of making every caller wait out a timeout. After a cool-down it lets a trial request through, and if that succeeds it closes again. It’s how one struggling payment provider avoids dragging every other service down with it.
Timeout Budgets
Each hop’s timeout should be shorter than the timeout of whoever called it. If the gateway gives up after 3 seconds but the payment call is allowed 10, the user sees an error while the system carries on charging a card for a request nobody is waiting on. Work from the outside in: decide how long the user will wait, and give each inner call a slice of it.
The Double-Click Problem: Idempotency
Here’s the question every write request eventually forces. What if this request arrives twice?
It happens constantly and for innocent reasons: an impatient double-click, a mobile app that retries after a flaky connection, a gateway or load balancer that retries after a timeout, a client that never received the response even though the order succeeded. For a GET that’s harmless. For a POST that creates an order and charges a card, it’s a double charge.
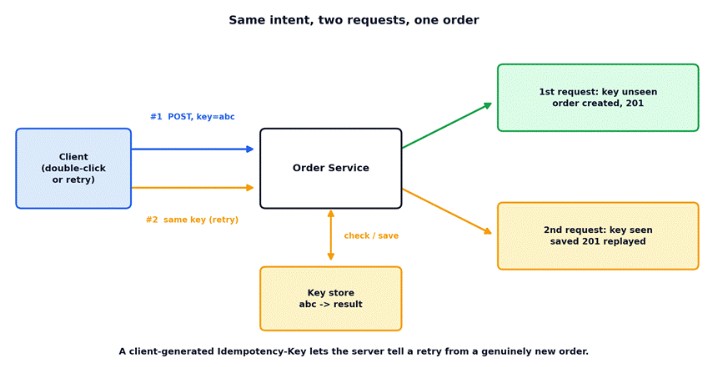
Figure 7 – The same intent arrives twice; the server creates one order and replays the saved answer.
The standard solution is the idempotency key you saw in the request headers. The client generates a unique key per intent and sends it with every attempt. The server records each key together with the result of processing it. When the first request arrives it does the work and saves the result; when a retry arrives with the same key, the server recognizes it and replays the saved response instead of doing the work again. Payment APIs such as Stripe’s popularized this pattern, and it belongs on any endpoint where duplicate side effects would hurt.
Two details matter in practice. The key check and the work must be atomic, or two simultaneous retries can both slip through. And keys need an expiry window, so the store doesn’t grow forever.
The Interview Question You Should Actually Prepare For
“Walk me through what happens when a user places an order in an e-commerce app.” is a system design question disguised as a simple one. Interviewers are listening for whether you can hold the whole path in your head.
A Stronger Answer
“The app resolves the API’s hostname through DNS and opens a TLS connection, usually reusing an existing one. The request hits a CDN edge, which passes dynamic calls to a load balancer that picks a healthy gateway instance. The gateway validates the JWT, applies rate limits, and routes to the order service with a trace ID attached. The service validates the cart, calls inventory and payment synchronously with timeouts, writes the order to the primary database in a transaction, and publishes an event through an outbox so email and shipping happen asynchronously. It returns 201, and the response retraces the path. The order endpoint takes an idempotency key so retries can’t create duplicates, and traces let us see which hop is slow.”
Then be ready for the follow-ups, which are all in the sections above: what if the payment service is down, what if the response is lost, how do you keep the email from blocking checkout, and how do you find the slow hop.
The Big Picture
Think about how a parcel gets from your door to someone else’s. It doesn’t go direct. It goes to a local depot, a sorting hub, a long-haul leg, a regional hub and finally a delivery van, and each stop does one narrow job. A tracking number follows the parcel the whole way, so anyone can say exactly where it is. And if the label is unreadable, it’s rejected at the first depot rather than discovered at the last.
A backend works the same way. Narrow jobs at each hop, an ID that follows the request everywhere, and cheap rejection as early as possible. The architecture diagrams in this series each zoom in on one of those depots. This post is the route map that connects them.
Every request is a relay race. Your job as an engineer is to know every runner, and to be able to see exactly where the baton was dropped.
Next time something is slow or broken, resist the urge to guess. Start at the first stop, follow the request, and let the trace tell you where it stopped being fast.
Want to understand how real-world backend systems work and build the skills to design them confidently? Get in touch with our team to explore practical learning paths in system design, backend engineering and DevOps that support your career goals.